single cell Search Results


96
Broad Clinical Labs picard sequencing metrics
a , Schematic workflow going from hiPS cells to cortical organoids to <t>sequencing</t> data. The number of hiPS cell lines and individuals (in parentheses) for each form of ASD and controls is indicated. b , Schematic representation of hCO differentiations derived from each hiPS cell line for two forms of ASD (16p11.2 deletion and 22q13.3 deletion). The other forms of ASD can be found in Extended Data Fig. . c , Spearman’s correlation of gene expression between samples from the same time point and form of ASD that were derived either from different lines (red) or from the same line (blue). The sample sizes for each group (number of differentiations) are as follows: day 25: control lines, n = 46; 15q13.3del, n = 7; 16p11.2del, n = 5; 16p11.2dup, n = 4; 22q11.2del, n = 13; 22q13.3del, n = 11; idiopathic, n = 12; PCDH19, n = 2; SHANK3, n = 2; and Timothy syndrome, n = 3. Day 50: control lines, n = 53; 15q13.3del, n = 7; 16p11.2del, n = 6; 16p11.2dup, n = 4; 22q11.2del, n = 15; 22q13.3del, n = 12; idiopathic, n = 15; PCDH19 , n = 2; SHANK3, n = 2; and Timothy syndrome, n = 3. Day 75: control lines, n = 54; 15q13.3del, n = 7; 16p11.2del, n = 6; 16p11.2dup, n = 4; 22q11.2del, n = 23; 22q13.3del, n = 12; idiopathic, n = 15; PCDH19, n = 2; SHANK3, n = 2; and Timothy syndrome, n = 2. Day 100: control lines, n = 50; 15q13.3del, n = 6; 16p11.2del, n = 6; 16p11.2dup, n = 4; 22q11.2del, n = 15; 22q13.3del, n = 12; idiopathic, n = 15; PCDH19, n = 2; SHANK3, n = 2; and Timothy syndrome, n = 2. Boxplots show: centre, median; lower hinge, 25% quantile; upper hinge, 75% quantile; lower whisker, smallest observation greater than or equal to lower hinge −1.5× interquartile range; upper whisker, largest observation less than or equal to upper hinge +1.5× interquartile range. d , Genes within the CNVs are downregulated in deletions and upregulated in duplications, as exemplified by 16p11.2 deletion (del) and duplication (dup) and 15q13.3 deletion. 16p11.2del, 61.5% of genes; 16p11.2dup, 50% of genes and 15q13.3del, 52.9% of genes. *dreamlet P values of less than 0.005. Top illustration adapted from ref. , Springer Nature America; illustrations in the IP–MS and CRISPRi panels created in BioRender. Geschwind, D. (2025) ( https://biorender.com/m2jkj03 ).
Picard Sequencing Metrics, supplied by Broad Clinical Labs, used in various techniques. Bioz Stars score: 96/100, based on 1 PubMed citations. ZERO BIAS - scores, article reviews, protocol conditions and more
https://www.bioz.com/result/picard sequencing metrics/product/Broad Clinical Labs
Average 96 stars, based on 1 article reviews
picard sequencing metrics - by Bioz Stars, 2026-04
96/100 stars
  Buy from Supplier

97
New England Biolabs nebnext single cell low input rna library prep kit
a , Schematic workflow going from hiPS cells to cortical organoids to <t>sequencing</t> data. The number of hiPS cell lines and individuals (in parentheses) for each form of ASD and controls is indicated. b , Schematic representation of hCO differentiations derived from each hiPS cell line for two forms of ASD (16p11.2 deletion and 22q13.3 deletion). The other forms of ASD can be found in Extended Data Fig. . c , Spearman’s correlation of gene expression between samples from the same time point and form of ASD that were derived either from different lines (red) or from the same line (blue). The sample sizes for each group (number of differentiations) are as follows: day 25: control lines, n = 46; 15q13.3del, n = 7; 16p11.2del, n = 5; 16p11.2dup, n = 4; 22q11.2del, n = 13; 22q13.3del, n = 11; idiopathic, n = 12; PCDH19, n = 2; SHANK3, n = 2; and Timothy syndrome, n = 3. Day 50: control lines, n = 53; 15q13.3del, n = 7; 16p11.2del, n = 6; 16p11.2dup, n = 4; 22q11.2del, n = 15; 22q13.3del, n = 12; idiopathic, n = 15; PCDH19 , n = 2; SHANK3, n = 2; and Timothy syndrome, n = 3. Day 75: control lines, n = 54; 15q13.3del, n = 7; 16p11.2del, n = 6; 16p11.2dup, n = 4; 22q11.2del, n = 23; 22q13.3del, n = 12; idiopathic, n = 15; PCDH19, n = 2; SHANK3, n = 2; and Timothy syndrome, n = 2. Day 100: control lines, n = 50; 15q13.3del, n = 6; 16p11.2del, n = 6; 16p11.2dup, n = 4; 22q11.2del, n = 15; 22q13.3del, n = 12; idiopathic, n = 15; PCDH19, n = 2; SHANK3, n = 2; and Timothy syndrome, n = 2. Boxplots show: centre, median; lower hinge, 25% quantile; upper hinge, 75% quantile; lower whisker, smallest observation greater than or equal to lower hinge −1.5× interquartile range; upper whisker, largest observation less than or equal to upper hinge +1.5× interquartile range. d , Genes within the CNVs are downregulated in deletions and upregulated in duplications, as exemplified by 16p11.2 deletion (del) and duplication (dup) and 15q13.3 deletion. 16p11.2del, 61.5% of genes; 16p11.2dup, 50% of genes and 15q13.3del, 52.9% of genes. *dreamlet P values of less than 0.005. Top illustration adapted from ref. , Springer Nature America; illustrations in the IP–MS and CRISPRi panels created in BioRender. Geschwind, D. (2025) ( https://biorender.com/m2jkj03 ).
Nebnext Single Cell Low Input Rna Library Prep Kit, supplied by New England Biolabs, used in various techniques. Bioz Stars score: 97/100, based on 1 PubMed citations. ZERO BIAS - scores, article reviews, protocol conditions and more
https://www.bioz.com/result/nebnext single cell low input rna library prep kit/product/New England Biolabs
Average 97 stars, based on 1 article reviews
nebnext single cell low input rna library prep kit - by Bioz Stars, 2026-04
97/100 stars
  Buy from Supplier

95
Trevigen comet assay kit
a , Schematic workflow going from hiPS cells to cortical organoids to <t>sequencing</t> data. The number of hiPS cell lines and individuals (in parentheses) for each form of ASD and controls is indicated. b , Schematic representation of hCO differentiations derived from each hiPS cell line for two forms of ASD (16p11.2 deletion and 22q13.3 deletion). The other forms of ASD can be found in Extended Data Fig. . c , Spearman’s correlation of gene expression between samples from the same time point and form of ASD that were derived either from different lines (red) or from the same line (blue). The sample sizes for each group (number of differentiations) are as follows: day 25: control lines, n = 46; 15q13.3del, n = 7; 16p11.2del, n = 5; 16p11.2dup, n = 4; 22q11.2del, n = 13; 22q13.3del, n = 11; idiopathic, n = 12; PCDH19, n = 2; SHANK3, n = 2; and Timothy syndrome, n = 3. Day 50: control lines, n = 53; 15q13.3del, n = 7; 16p11.2del, n = 6; 16p11.2dup, n = 4; 22q11.2del, n = 15; 22q13.3del, n = 12; idiopathic, n = 15; PCDH19 , n = 2; SHANK3, n = 2; and Timothy syndrome, n = 3. Day 75: control lines, n = 54; 15q13.3del, n = 7; 16p11.2del, n = 6; 16p11.2dup, n = 4; 22q11.2del, n = 23; 22q13.3del, n = 12; idiopathic, n = 15; PCDH19, n = 2; SHANK3, n = 2; and Timothy syndrome, n = 2. Day 100: control lines, n = 50; 15q13.3del, n = 6; 16p11.2del, n = 6; 16p11.2dup, n = 4; 22q11.2del, n = 15; 22q13.3del, n = 12; idiopathic, n = 15; PCDH19, n = 2; SHANK3, n = 2; and Timothy syndrome, n = 2. Boxplots show: centre, median; lower hinge, 25% quantile; upper hinge, 75% quantile; lower whisker, smallest observation greater than or equal to lower hinge −1.5× interquartile range; upper whisker, largest observation less than or equal to upper hinge +1.5× interquartile range. d , Genes within the CNVs are downregulated in deletions and upregulated in duplications, as exemplified by 16p11.2 deletion (del) and duplication (dup) and 15q13.3 deletion. 16p11.2del, 61.5% of genes; 16p11.2dup, 50% of genes and 15q13.3del, 52.9% of genes. *dreamlet P values of less than 0.005. Top illustration adapted from ref. , Springer Nature America; illustrations in the IP–MS and CRISPRi panels created in BioRender. Geschwind, D. (2025) ( https://biorender.com/m2jkj03 ).
Comet Assay Kit, supplied by Trevigen, used in various techniques. Bioz Stars score: 95/100, based on 1 PubMed citations. ZERO BIAS - scores, article reviews, protocol conditions and more
https://www.bioz.com/result/comet assay kit/product/Trevigen
Average 95 stars, based on 1 article reviews
comet assay kit - by Bioz Stars, 2026-04
95/100 stars
  Buy from Supplier

97
Norgen Biotek single cell rna purification kit norgen biotek corp
a , Schematic workflow going from hiPS cells to cortical organoids to <t>sequencing</t> data. The number of hiPS cell lines and individuals (in parentheses) for each form of ASD and controls is indicated. b , Schematic representation of hCO differentiations derived from each hiPS cell line for two forms of ASD (16p11.2 deletion and 22q13.3 deletion). The other forms of ASD can be found in Extended Data Fig. . c , Spearman’s correlation of gene expression between samples from the same time point and form of ASD that were derived either from different lines (red) or from the same line (blue). The sample sizes for each group (number of differentiations) are as follows: day 25: control lines, n = 46; 15q13.3del, n = 7; 16p11.2del, n = 5; 16p11.2dup, n = 4; 22q11.2del, n = 13; 22q13.3del, n = 11; idiopathic, n = 12; PCDH19, n = 2; SHANK3, n = 2; and Timothy syndrome, n = 3. Day 50: control lines, n = 53; 15q13.3del, n = 7; 16p11.2del, n = 6; 16p11.2dup, n = 4; 22q11.2del, n = 15; 22q13.3del, n = 12; idiopathic, n = 15; PCDH19 , n = 2; SHANK3, n = 2; and Timothy syndrome, n = 3. Day 75: control lines, n = 54; 15q13.3del, n = 7; 16p11.2del, n = 6; 16p11.2dup, n = 4; 22q11.2del, n = 23; 22q13.3del, n = 12; idiopathic, n = 15; PCDH19, n = 2; SHANK3, n = 2; and Timothy syndrome, n = 2. Day 100: control lines, n = 50; 15q13.3del, n = 6; 16p11.2del, n = 6; 16p11.2dup, n = 4; 22q11.2del, n = 15; 22q13.3del, n = 12; idiopathic, n = 15; PCDH19, n = 2; SHANK3, n = 2; and Timothy syndrome, n = 2. Boxplots show: centre, median; lower hinge, 25% quantile; upper hinge, 75% quantile; lower whisker, smallest observation greater than or equal to lower hinge −1.5× interquartile range; upper whisker, largest observation less than or equal to upper hinge +1.5× interquartile range. d , Genes within the CNVs are downregulated in deletions and upregulated in duplications, as exemplified by 16p11.2 deletion (del) and duplication (dup) and 15q13.3 deletion. 16p11.2del, 61.5% of genes; 16p11.2dup, 50% of genes and 15q13.3del, 52.9% of genes. *dreamlet P values of less than 0.005. Top illustration adapted from ref. , Springer Nature America; illustrations in the IP–MS and CRISPRi panels created in BioRender. Geschwind, D. (2025) ( https://biorender.com/m2jkj03 ).
Single Cell Rna Purification Kit Norgen Biotek Corp, supplied by Norgen Biotek, used in various techniques. Bioz Stars score: 97/100, based on 1 PubMed citations. ZERO BIAS - scores, article reviews, protocol conditions and more
https://www.bioz.com/result/single cell rna purification kit norgen biotek corp/product/Norgen Biotek
Average 97 stars, based on 1 article reviews
single cell rna purification kit norgen biotek corp - by Bioz Stars, 2026-04
97/100 stars
  Buy from Supplier

96
Molecular Devices LLC cloneselect a g
( A ) Conceptual diagram of retrospective clone isolation. ( B ) Different barcode-specific gRNA-dependent reporter activation circuits. <t>CloneSelect</t> C→T, low-copy CRISPRa, and high-copy CRISPRa. ( C ) Flow cytometry analysis of single-cell EGFP activation levels. ( D ) Barcode-dependent reporter activation of six barcoded cell lines by CloneSelect C→T. Scale bar, 50 μm. ( E ) Comparison of CloneSelect C→T, low-copy CRISPRa, and high-copy CRISPRa across the same barcode-gRNA pairs (n=3). For each approach, Welch’s t-test was performed to compare on-target (OT) and non-target (NT) activations. ( F ) CloneSelect <t>A→G.</t> ( G ) Comparison of CloneSelect A→G, low-copy CRISPRa, and high-copy CRISPRa across the same barcode-gRNA pairs (n=3). Welch’s t-test was performed to compare OT and NT activations. ( H ) ROC curves along varying EGFP intensity thresholds for target barcoded cells. Left, CloneSelect C→T and low-copy CRISPRa by the same targeting gRNAs. Right, CloneSelect A→G and low-copy CRISPRa for the same set of targeting gRNAs. ( I ) Performance comparison of CloneSelect C→T and CloneSelect A→G. Activated cell frequencies of OT and NT barcodes were normalized by activated cell frequencies of OT barcodes conferred by low-copy CRISPRa using the same targeting gRNA. The Mann-Whitney U test was performed to compare the two groups of datasets. * P < 0.05; ** P < 0.01; *** P < 0.001.
Cloneselect A G, supplied by Molecular Devices LLC, used in various techniques. Bioz Stars score: 96/100, based on 1 PubMed citations. ZERO BIAS - scores, article reviews, protocol conditions and more
https://www.bioz.com/result/cloneselect a g/product/Molecular Devices LLC
Average 96 stars, based on 1 article reviews
cloneselect a g - by Bioz Stars, 2026-04
96/100 stars
  Buy from Supplier

93
Qiagen qiaseq fx single cell rna library kit
( A ) Conceptual diagram of retrospective clone isolation. ( B ) Different barcode-specific gRNA-dependent reporter activation circuits. <t>CloneSelect</t> C→T, low-copy CRISPRa, and high-copy CRISPRa. ( C ) Flow cytometry analysis of single-cell EGFP activation levels. ( D ) Barcode-dependent reporter activation of six barcoded cell lines by CloneSelect C→T. Scale bar, 50 μm. ( E ) Comparison of CloneSelect C→T, low-copy CRISPRa, and high-copy CRISPRa across the same barcode-gRNA pairs (n=3). For each approach, Welch’s t-test was performed to compare on-target (OT) and non-target (NT) activations. ( F ) CloneSelect <t>A→G.</t> ( G ) Comparison of CloneSelect A→G, low-copy CRISPRa, and high-copy CRISPRa across the same barcode-gRNA pairs (n=3). Welch’s t-test was performed to compare OT and NT activations. ( H ) ROC curves along varying EGFP intensity thresholds for target barcoded cells. Left, CloneSelect C→T and low-copy CRISPRa by the same targeting gRNAs. Right, CloneSelect A→G and low-copy CRISPRa for the same set of targeting gRNAs. ( I ) Performance comparison of CloneSelect C→T and CloneSelect A→G. Activated cell frequencies of OT and NT barcodes were normalized by activated cell frequencies of OT barcodes conferred by low-copy CRISPRa using the same targeting gRNA. The Mann-Whitney U test was performed to compare the two groups of datasets. * P < 0.05; ** P < 0.01; *** P < 0.001.
Qiaseq Fx Single Cell Rna Library Kit, supplied by Qiagen, used in various techniques. Bioz Stars score: 93/100, based on 1 PubMed citations. ZERO BIAS - scores, article reviews, protocol conditions and more
https://www.bioz.com/result/qiaseq fx single cell rna library kit/product/Qiagen
Average 93 stars, based on 1 article reviews
qiaseq fx single cell rna library kit - by Bioz Stars, 2026-04
93/100 stars
  Buy from Supplier

98
Qiagen repli g wta single cell kit
( A ) Conceptual diagram of retrospective clone isolation. ( B ) Different barcode-specific gRNA-dependent reporter activation circuits. <t>CloneSelect</t> C→T, low-copy CRISPRa, and high-copy CRISPRa. ( C ) Flow cytometry analysis of single-cell EGFP activation levels. ( D ) Barcode-dependent reporter activation of six barcoded cell lines by CloneSelect C→T. Scale bar, 50 μm. ( E ) Comparison of CloneSelect C→T, low-copy CRISPRa, and high-copy CRISPRa across the same barcode-gRNA pairs (n=3). For each approach, Welch’s t-test was performed to compare on-target (OT) and non-target (NT) activations. ( F ) CloneSelect <t>A→G.</t> ( G ) Comparison of CloneSelect A→G, low-copy CRISPRa, and high-copy CRISPRa across the same barcode-gRNA pairs (n=3). Welch’s t-test was performed to compare OT and NT activations. ( H ) ROC curves along varying EGFP intensity thresholds for target barcoded cells. Left, CloneSelect C→T and low-copy CRISPRa by the same targeting gRNAs. Right, CloneSelect A→G and low-copy CRISPRa for the same set of targeting gRNAs. ( I ) Performance comparison of CloneSelect C→T and CloneSelect A→G. Activated cell frequencies of OT and NT barcodes were normalized by activated cell frequencies of OT barcodes conferred by low-copy CRISPRa using the same targeting gRNA. The Mann-Whitney U test was performed to compare the two groups of datasets. * P < 0.05; ** P < 0.01; *** P < 0.001.
Repli G Wta Single Cell Kit, supplied by Qiagen, used in various techniques. Bioz Stars score: 98/100, based on 1 PubMed citations. ZERO BIAS - scores, article reviews, protocol conditions and more
https://www.bioz.com/result/repli g wta single cell kit/product/Qiagen
Average 98 stars, based on 1 article reviews
repli g wta single cell kit - by Bioz Stars, 2026-04
98/100 stars
  Buy from Supplier

96
R&D Systems systems 4250 050 k
( A ) Conceptual diagram of retrospective clone isolation. ( B ) Different barcode-specific gRNA-dependent reporter activation circuits. <t>CloneSelect</t> C→T, low-copy CRISPRa, and high-copy CRISPRa. ( C ) Flow cytometry analysis of single-cell EGFP activation levels. ( D ) Barcode-dependent reporter activation of six barcoded cell lines by CloneSelect C→T. Scale bar, 50 μm. ( E ) Comparison of CloneSelect C→T, low-copy CRISPRa, and high-copy CRISPRa across the same barcode-gRNA pairs (n=3). For each approach, Welch’s t-test was performed to compare on-target (OT) and non-target (NT) activations. ( F ) CloneSelect <t>A→G.</t> ( G ) Comparison of CloneSelect A→G, low-copy CRISPRa, and high-copy CRISPRa across the same barcode-gRNA pairs (n=3). Welch’s t-test was performed to compare OT and NT activations. ( H ) ROC curves along varying EGFP intensity thresholds for target barcoded cells. Left, CloneSelect C→T and low-copy CRISPRa by the same targeting gRNAs. Right, CloneSelect A→G and low-copy CRISPRa for the same set of targeting gRNAs. ( I ) Performance comparison of CloneSelect C→T and CloneSelect A→G. Activated cell frequencies of OT and NT barcodes were normalized by activated cell frequencies of OT barcodes conferred by low-copy CRISPRa using the same targeting gRNA. The Mann-Whitney U test was performed to compare the two groups of datasets. * P < 0.05; ** P < 0.01; *** P < 0.001.
Systems 4250 050 K, supplied by R&D Systems, used in various techniques. Bioz Stars score: 96/100, based on 1 PubMed citations. ZERO BIAS - scores, article reviews, protocol conditions and more
https://www.bioz.com/result/systems 4250 050 k/product/R&D Systems
Average 96 stars, based on 1 article reviews
systems 4250 050 k - by Bioz Stars, 2026-04
96/100 stars
  Buy from Supplier

93
Qiagen repli g single cell kit
( A ) Conceptual diagram of retrospective clone isolation. ( B ) Different barcode-specific gRNA-dependent reporter activation circuits. <t>CloneSelect</t> C→T, low-copy CRISPRa, and high-copy CRISPRa. ( C ) Flow cytometry analysis of single-cell EGFP activation levels. ( D ) Barcode-dependent reporter activation of six barcoded cell lines by CloneSelect C→T. Scale bar, 50 μm. ( E ) Comparison of CloneSelect C→T, low-copy CRISPRa, and high-copy CRISPRa across the same barcode-gRNA pairs (n=3). For each approach, Welch’s t-test was performed to compare on-target (OT) and non-target (NT) activations. ( F ) CloneSelect <t>A→G.</t> ( G ) Comparison of CloneSelect A→G, low-copy CRISPRa, and high-copy CRISPRa across the same barcode-gRNA pairs (n=3). Welch’s t-test was performed to compare OT and NT activations. ( H ) ROC curves along varying EGFP intensity thresholds for target barcoded cells. Left, CloneSelect C→T and low-copy CRISPRa by the same targeting gRNAs. Right, CloneSelect A→G and low-copy CRISPRa for the same set of targeting gRNAs. ( I ) Performance comparison of CloneSelect C→T and CloneSelect A→G. Activated cell frequencies of OT and NT barcodes were normalized by activated cell frequencies of OT barcodes conferred by low-copy CRISPRa using the same targeting gRNA. The Mann-Whitney U test was performed to compare the two groups of datasets. * P < 0.05; ** P < 0.01; *** P < 0.001.
Repli G Single Cell Kit, supplied by Qiagen, used in various techniques. Bioz Stars score: 93/100, based on 1 PubMed citations. ZERO BIAS - scores, article reviews, protocol conditions and more
https://www.bioz.com/result/repli g single cell kit/product/Qiagen
Average 93 stars, based on 1 article reviews
repli g single cell kit - by Bioz Stars, 2026-04
93/100 stars
  Buy from Supplier

94
Bio-Rad ddseq single cell isolator
Patient-derived organoids (PDOs) recapitulate transcriptional heterogeneity of primary pancreatic ductal adenocarcinoma (PDAC) and reveal recurrent programs (RPs). A and B Uniform manifold approximation and projections (UMAPs) <t>of</t> <t>single-cell</t> transcriptomes from 17 PDOs, analyzed sample by sample. The cells were clustered within each PDO, and UMAPs are shown separately for primary ( A ) and metastasis PDOs ( B ). C Pairwise similarity analysis of gene expression programs (GEPs) identified by consensus nonnegative matrix factorization (cNMF) across the 17 PDOs. The heatmap shows the pairwise similarity matrix of 108 GEPs, which was quantified using the Jaccard index, with hierarchical clustering revealing eight major clusters defined as RPs shared across multiple PDOs. The eight RP assignments and representative genes for each RP are shown on the right. D Heatmap showing the degree of gene-level overlap between the eight RPs that were identified in this study and the 14 GEPs that were previously reported from single-cell transcriptomic analysis of PDAC patient specimens. E Differential analysis of RP activity between primary and metastasis PDOs
Ddseq Single Cell Isolator, supplied by Bio-Rad, used in various techniques. Bioz Stars score: 94/100, based on 1 PubMed citations. ZERO BIAS - scores, article reviews, protocol conditions and more
https://www.bioz.com/result/ddseq single cell isolator/product/Bio-Rad
Average 94 stars, based on 1 article reviews
ddseq single cell isolator - by Bioz Stars, 2026-04
94/100 stars
  Buy from Supplier

Image Search Results


a , Schematic workflow going from hiPS cells to cortical organoids to sequencing data. The number of hiPS cell lines and individuals (in parentheses) for each form of ASD and controls is indicated. b , Schematic representation of hCO differentiations derived from each hiPS cell line for two forms of ASD (16p11.2 deletion and 22q13.3 deletion). The other forms of ASD can be found in Extended Data Fig. . c , Spearman’s correlation of gene expression between samples from the same time point and form of ASD that were derived either from different lines (red) or from the same line (blue). The sample sizes for each group (number of differentiations) are as follows: day 25: control lines, n = 46; 15q13.3del, n = 7; 16p11.2del, n = 5; 16p11.2dup, n = 4; 22q11.2del, n = 13; 22q13.3del, n = 11; idiopathic, n = 12; PCDH19, n = 2; SHANK3, n = 2; and Timothy syndrome, n = 3. Day 50: control lines, n = 53; 15q13.3del, n = 7; 16p11.2del, n = 6; 16p11.2dup, n = 4; 22q11.2del, n = 15; 22q13.3del, n = 12; idiopathic, n = 15; PCDH19 , n = 2; SHANK3, n = 2; and Timothy syndrome, n = 3. Day 75: control lines, n = 54; 15q13.3del, n = 7; 16p11.2del, n = 6; 16p11.2dup, n = 4; 22q11.2del, n = 23; 22q13.3del, n = 12; idiopathic, n = 15; PCDH19, n = 2; SHANK3, n = 2; and Timothy syndrome, n = 2. Day 100: control lines, n = 50; 15q13.3del, n = 6; 16p11.2del, n = 6; 16p11.2dup, n = 4; 22q11.2del, n = 15; 22q13.3del, n = 12; idiopathic, n = 15; PCDH19, n = 2; SHANK3, n = 2; and Timothy syndrome, n = 2. Boxplots show: centre, median; lower hinge, 25% quantile; upper hinge, 75% quantile; lower whisker, smallest observation greater than or equal to lower hinge −1.5× interquartile range; upper whisker, largest observation less than or equal to upper hinge +1.5× interquartile range. d , Genes within the CNVs are downregulated in deletions and upregulated in duplications, as exemplified by 16p11.2 deletion (del) and duplication (dup) and 15q13.3 deletion. 16p11.2del, 61.5% of genes; 16p11.2dup, 50% of genes and 15q13.3del, 52.9% of genes. *dreamlet P values of less than 0.005. Top illustration adapted from ref. , Springer Nature America; illustrations in the IP–MS and CRISPRi panels created in BioRender. Geschwind, D. (2025) ( https://biorender.com/m2jkj03 ).

Journal: Nature

Article Title: Developmental convergence and divergence in human stem cell models of autism

doi: 10.1038/s41586-025-10047-5

Figure Lengend Snippet: a , Schematic workflow going from hiPS cells to cortical organoids to sequencing data. The number of hiPS cell lines and individuals (in parentheses) for each form of ASD and controls is indicated. b , Schematic representation of hCO differentiations derived from each hiPS cell line for two forms of ASD (16p11.2 deletion and 22q13.3 deletion). The other forms of ASD can be found in Extended Data Fig. . c , Spearman’s correlation of gene expression between samples from the same time point and form of ASD that were derived either from different lines (red) or from the same line (blue). The sample sizes for each group (number of differentiations) are as follows: day 25: control lines, n = 46; 15q13.3del, n = 7; 16p11.2del, n = 5; 16p11.2dup, n = 4; 22q11.2del, n = 13; 22q13.3del, n = 11; idiopathic, n = 12; PCDH19, n = 2; SHANK3, n = 2; and Timothy syndrome, n = 3. Day 50: control lines, n = 53; 15q13.3del, n = 7; 16p11.2del, n = 6; 16p11.2dup, n = 4; 22q11.2del, n = 15; 22q13.3del, n = 12; idiopathic, n = 15; PCDH19 , n = 2; SHANK3, n = 2; and Timothy syndrome, n = 3. Day 75: control lines, n = 54; 15q13.3del, n = 7; 16p11.2del, n = 6; 16p11.2dup, n = 4; 22q11.2del, n = 23; 22q13.3del, n = 12; idiopathic, n = 15; PCDH19, n = 2; SHANK3, n = 2; and Timothy syndrome, n = 2. Day 100: control lines, n = 50; 15q13.3del, n = 6; 16p11.2del, n = 6; 16p11.2dup, n = 4; 22q11.2del, n = 15; 22q13.3del, n = 12; idiopathic, n = 15; PCDH19, n = 2; SHANK3, n = 2; and Timothy syndrome, n = 2. Boxplots show: centre, median; lower hinge, 25% quantile; upper hinge, 75% quantile; lower whisker, smallest observation greater than or equal to lower hinge −1.5× interquartile range; upper whisker, largest observation less than or equal to upper hinge +1.5× interquartile range. d , Genes within the CNVs are downregulated in deletions and upregulated in duplications, as exemplified by 16p11.2 deletion (del) and duplication (dup) and 15q13.3 deletion. 16p11.2del, 61.5% of genes; 16p11.2dup, 50% of genes and 15q13.3del, 52.9% of genes. *dreamlet P values of less than 0.005. Top illustration adapted from ref. , Springer Nature America; illustrations in the IP–MS and CRISPRi panels created in BioRender. Geschwind, D. (2025) ( https://biorender.com/m2jkj03 ).

Article Snippet: To control for technical variation due to the sequencing and library prep we calculated the principal components of the Picard sequencing metrics ( http://broadinstitute.github.io/picard/ ) using the CollectAlignmentSummaryMetrics, CollectRnaSeqMetrics and MarkDuplicates modules, and included them in our model. To infer genetic ancestry, we called single-nucleotide polymorphisms (SNPs) from the aligned reads using the GATK (v.3.3) Haplotype caller .

Techniques: Sequencing, Derivative Assay, Gene Expression, Control, Whisker Assay, Protein-Protein interactions

Whole genome sequencing depth in ( a ) 16p11.2 ( b ) 15q13.3 ( c ) 22q11.2 and ( d ) 22q13.3 loci averaged over 10 kb windows. ( e ) Mutational forms not shown in main figure showing genes inside the CNV locus or genes carrying the point mutations (marked in blue). Genes significantly differentially expressed over all time points are denoted by asterisks (dreamlet p-values of p < 0.005). The percent of DE genes in the CNV across the 4 time points is as follows: 22q13del - 77.3% of genes, 22q11del - 88.9% of genes.

Journal: Nature

Article Title: Developmental convergence and divergence in human stem cell models of autism

doi: 10.1038/s41586-025-10047-5

Figure Lengend Snippet: Whole genome sequencing depth in ( a ) 16p11.2 ( b ) 15q13.3 ( c ) 22q11.2 and ( d ) 22q13.3 loci averaged over 10 kb windows. ( e ) Mutational forms not shown in main figure showing genes inside the CNV locus or genes carrying the point mutations (marked in blue). Genes significantly differentially expressed over all time points are denoted by asterisks (dreamlet p-values of p < 0.005). The percent of DE genes in the CNV across the 4 time points is as follows: 22q13del - 77.3% of genes, 22q11del - 88.9% of genes.

Article Snippet: To control for technical variation due to the sequencing and library prep we calculated the principal components of the Picard sequencing metrics ( http://broadinstitute.github.io/picard/ ) using the CollectAlignmentSummaryMetrics, CollectRnaSeqMetrics and MarkDuplicates modules, and included them in our model. To infer genetic ancestry, we called single-nucleotide polymorphisms (SNPs) from the aligned reads using the GATK (v.3.3) Haplotype caller .

Techniques: Sequencing

( a ) Overlaps between differentially expressed genes at all time points and risk genes for ASD from either SFARI or from large scale whole exome (WES) sequencing studies , as well as with neurodevelopmental disorders (NDDs) and intellectual disability (ID) risk genes . Colour represents the OR (two-sided Fishers exact test) and the size of the point represented the -log 10 FDR. Only positive significant overlaps (OR > 1 and FDR < 0.05) are shown. ( b ) Select gene ontology (GO) terms enriched in upregulated (red) or downregulated (blue) genes in each of the ASD forms at day 25 (top) or day 100 (bottom). Statistics derived from GSEA. ( c ) Distribution of normalized expression for meta analysis significant example genes at day 100. Boxplots show: centre, median, lower hinge – 25% quantile, upper hinge – 75% quantile, lower whisker – smallest observation greater than or equal to lower hinge –1.5× interquartile range, upper whisker – largest observation less than or equal to upper hinge +1.5× interquartile range. Number of samples (differentiations) for each form: Control – 50, 15q13.3del – 6, 16p11.2del – 6, 16p11.2dup – 4, 22q11.2del – 15, 22q13.3del – 12, Idiopathic – 15, PCDH19 – 2, SHANK3 – 2, Timothy Syndrome – 2. Asterisks denote dreamlet derived p-values: +p < 0.005,* FDR < 0.05, ** FDR < 0.01, *** FDR < 0.005. ( d ) Select GO terms enriched in upregulated or downregulated meta-analysis significant genes Colour corresponds to normalized enrichment score (NES). Point size corresponds to the level of significance (−log 10 (FDR)). Statistics derived from GSEA.

Journal: Nature

Article Title: Developmental convergence and divergence in human stem cell models of autism

doi: 10.1038/s41586-025-10047-5

Figure Lengend Snippet: ( a ) Overlaps between differentially expressed genes at all time points and risk genes for ASD from either SFARI or from large scale whole exome (WES) sequencing studies , as well as with neurodevelopmental disorders (NDDs) and intellectual disability (ID) risk genes . Colour represents the OR (two-sided Fishers exact test) and the size of the point represented the -log 10 FDR. Only positive significant overlaps (OR > 1 and FDR < 0.05) are shown. ( b ) Select gene ontology (GO) terms enriched in upregulated (red) or downregulated (blue) genes in each of the ASD forms at day 25 (top) or day 100 (bottom). Statistics derived from GSEA. ( c ) Distribution of normalized expression for meta analysis significant example genes at day 100. Boxplots show: centre, median, lower hinge – 25% quantile, upper hinge – 75% quantile, lower whisker – smallest observation greater than or equal to lower hinge –1.5× interquartile range, upper whisker – largest observation less than or equal to upper hinge +1.5× interquartile range. Number of samples (differentiations) for each form: Control – 50, 15q13.3del – 6, 16p11.2del – 6, 16p11.2dup – 4, 22q11.2del – 15, 22q13.3del – 12, Idiopathic – 15, PCDH19 – 2, SHANK3 – 2, Timothy Syndrome – 2. Asterisks denote dreamlet derived p-values: +p < 0.005,* FDR < 0.05, ** FDR < 0.01, *** FDR < 0.005. ( d ) Select GO terms enriched in upregulated or downregulated meta-analysis significant genes Colour corresponds to normalized enrichment score (NES). Point size corresponds to the level of significance (−log 10 (FDR)). Statistics derived from GSEA.

Article Snippet: To control for technical variation due to the sequencing and library prep we calculated the principal components of the Picard sequencing metrics ( http://broadinstitute.github.io/picard/ ) using the CollectAlignmentSummaryMetrics, CollectRnaSeqMetrics and MarkDuplicates modules, and included them in our model. To infer genetic ancestry, we called single-nucleotide polymorphisms (SNPs) from the aligned reads using the GATK (v.3.3) Haplotype caller .

Techniques: Sequencing, Derivative Assay, Expressing, Whisker Assay, Control

( a ) Schema of CROP-Seq vector. ( b ) Example of gating for flow cytometry. Left shows a set of hNPCs not expressing virus used for gating compared with hNPCs expressing both dCas9-Krab (GFP) and Crop-Seq-opti-dsRed (TdTomato). Box in the upper right shows double positive cells selected for downstream analysis (~20% of live cell fraction). ( c ) QC measures for CRISPRi single cell libraries organized by gRNA negative (no gRNA detected in sequencing), Control gRNA positive, or Target gRNA positive. ( d ) Number of gRNA UMIs per cell. X-axis shows cut-off of 10 UMIs used to consider a cell gRNA positive (left). Number of of unique gRNAs expressed in each cell (x-axis). Only cells expressing gRNA for a single gene-target are retained for downstream analyses. ( e ) Single cell UMAPs of markers used to differentiate cycling and non-cyling NPCs ( f ) Single cell UMAP coloured by Target-gene presence ( g ) Proportion of cells uniquely expressing gRNAs barcodes for each target within each experiment (n = 18 per Gene comprised of 6 technical replicates, 3 gRNAs barcodes per target, for Controls n = 108: 18 gRNAs across 6 technical replicates). TP53 show increased proportion compared to non-targeting controls (NTCs). Boxplots a-c show: centre, median, lower hinge – 25% quantile, upper hinge – 75% quantile, lower whisker – smallest observation greater than or equal to lower hinge –1.5× interquartile range, upper whisker – largest observation less than or equal to upper hinge +1.5× interquartile range. ***Family wise corrected p < 0.005, Dunnets post-hoc contrast of linear model.

Journal: Nature

Article Title: Developmental convergence and divergence in human stem cell models of autism

doi: 10.1038/s41586-025-10047-5

Figure Lengend Snippet: ( a ) Schema of CROP-Seq vector. ( b ) Example of gating for flow cytometry. Left shows a set of hNPCs not expressing virus used for gating compared with hNPCs expressing both dCas9-Krab (GFP) and Crop-Seq-opti-dsRed (TdTomato). Box in the upper right shows double positive cells selected for downstream analysis (~20% of live cell fraction). ( c ) QC measures for CRISPRi single cell libraries organized by gRNA negative (no gRNA detected in sequencing), Control gRNA positive, or Target gRNA positive. ( d ) Number of gRNA UMIs per cell. X-axis shows cut-off of 10 UMIs used to consider a cell gRNA positive (left). Number of of unique gRNAs expressed in each cell (x-axis). Only cells expressing gRNA for a single gene-target are retained for downstream analyses. ( e ) Single cell UMAPs of markers used to differentiate cycling and non-cyling NPCs ( f ) Single cell UMAP coloured by Target-gene presence ( g ) Proportion of cells uniquely expressing gRNAs barcodes for each target within each experiment (n = 18 per Gene comprised of 6 technical replicates, 3 gRNAs barcodes per target, for Controls n = 108: 18 gRNAs across 6 technical replicates). TP53 show increased proportion compared to non-targeting controls (NTCs). Boxplots a-c show: centre, median, lower hinge – 25% quantile, upper hinge – 75% quantile, lower whisker – smallest observation greater than or equal to lower hinge –1.5× interquartile range, upper whisker – largest observation less than or equal to upper hinge +1.5× interquartile range. ***Family wise corrected p < 0.005, Dunnets post-hoc contrast of linear model.

Article Snippet: To control for technical variation due to the sequencing and library prep we calculated the principal components of the Picard sequencing metrics ( http://broadinstitute.github.io/picard/ ) using the CollectAlignmentSummaryMetrics, CollectRnaSeqMetrics and MarkDuplicates modules, and included them in our model. To infer genetic ancestry, we called single-nucleotide polymorphisms (SNPs) from the aligned reads using the GATK (v.3.3) Haplotype caller .

Techniques: Plasmid Preparation, Flow Cytometry, Expressing, Virus, Single Cell, Sequencing, Control, Whisker Assay

( A ) Conceptual diagram of retrospective clone isolation. ( B ) Different barcode-specific gRNA-dependent reporter activation circuits. CloneSelect C→T, low-copy CRISPRa, and high-copy CRISPRa. ( C ) Flow cytometry analysis of single-cell EGFP activation levels. ( D ) Barcode-dependent reporter activation of six barcoded cell lines by CloneSelect C→T. Scale bar, 50 μm. ( E ) Comparison of CloneSelect C→T, low-copy CRISPRa, and high-copy CRISPRa across the same barcode-gRNA pairs (n=3). For each approach, Welch’s t-test was performed to compare on-target (OT) and non-target (NT) activations. ( F ) CloneSelect A→G. ( G ) Comparison of CloneSelect A→G, low-copy CRISPRa, and high-copy CRISPRa across the same barcode-gRNA pairs (n=3). Welch’s t-test was performed to compare OT and NT activations. ( H ) ROC curves along varying EGFP intensity thresholds for target barcoded cells. Left, CloneSelect C→T and low-copy CRISPRa by the same targeting gRNAs. Right, CloneSelect A→G and low-copy CRISPRa for the same set of targeting gRNAs. ( I ) Performance comparison of CloneSelect C→T and CloneSelect A→G. Activated cell frequencies of OT and NT barcodes were normalized by activated cell frequencies of OT barcodes conferred by low-copy CRISPRa using the same targeting gRNA. The Mann-Whitney U test was performed to compare the two groups of datasets. * P < 0.05; ** P < 0.01; *** P < 0.001.

Journal: bioRxiv

Article Title: A multi-kingdom genetic barcoding system for precise target clone isolation

doi: 10.1101/2023.01.18.524633

Figure Lengend Snippet: ( A ) Conceptual diagram of retrospective clone isolation. ( B ) Different barcode-specific gRNA-dependent reporter activation circuits. CloneSelect C→T, low-copy CRISPRa, and high-copy CRISPRa. ( C ) Flow cytometry analysis of single-cell EGFP activation levels. ( D ) Barcode-dependent reporter activation of six barcoded cell lines by CloneSelect C→T. Scale bar, 50 μm. ( E ) Comparison of CloneSelect C→T, low-copy CRISPRa, and high-copy CRISPRa across the same barcode-gRNA pairs (n=3). For each approach, Welch’s t-test was performed to compare on-target (OT) and non-target (NT) activations. ( F ) CloneSelect A→G. ( G ) Comparison of CloneSelect A→G, low-copy CRISPRa, and high-copy CRISPRa across the same barcode-gRNA pairs (n=3). Welch’s t-test was performed to compare OT and NT activations. ( H ) ROC curves along varying EGFP intensity thresholds for target barcoded cells. Left, CloneSelect C→T and low-copy CRISPRa by the same targeting gRNAs. Right, CloneSelect A→G and low-copy CRISPRa for the same set of targeting gRNAs. ( I ) Performance comparison of CloneSelect C→T and CloneSelect A→G. Activated cell frequencies of OT and NT barcodes were normalized by activated cell frequencies of OT barcodes conferred by low-copy CRISPRa using the same targeting gRNA. The Mann-Whitney U test was performed to compare the two groups of datasets. * P < 0.05; ** P < 0.01; *** P < 0.001.

Article Snippet: Similar to CloneSelect C→T, CloneSelect A→G activated the reporter expression for 12.27–31.47% of on-target cells, whereas the non-target activation was maintained below 0.5% with high orthogonality of barcodes and gRNAs.

Techniques: Isolation, Activation Assay, Flow Cytometry, MANN-WHITNEY

( A – C ) Barcode-specific gRNA-dependent activation of EGFP reporters for two barcoded HEK293T strains established for each of CloneSelect C→T ( A ), low-copy CRISPRa ( B ), and high-copy CRISPRa ( C ) (n=3). Scale bar, 50 μm. Welch’s t-test was performed to compare on-target (OT) and non-target (NT) activations. ( D ) Median EGFP intensities of genome editing-activated EGFP positive cells (n=3). The Mann-Whitney U test was performed to compare two groups. ( E ) Comparison of Target-AID variants and a nCas9 (D10A) control in the CloneSelect C→T reporter activation for the same set of barcode-gRNA pairs (n=1). Welch’s t-test was performed to compare OT and NT activations. ( F ) Reporter activation in HeLa cells by CloneSelect C→T (n=3). Welch’s t-test was performed to compare OT and NT activations. Scale bar, 80 μm. * P < 0.05; ** P < 0.01; *** P < 0.001.

Journal: bioRxiv

Article Title: A multi-kingdom genetic barcoding system for precise target clone isolation

doi: 10.1101/2023.01.18.524633

Figure Lengend Snippet: ( A – C ) Barcode-specific gRNA-dependent activation of EGFP reporters for two barcoded HEK293T strains established for each of CloneSelect C→T ( A ), low-copy CRISPRa ( B ), and high-copy CRISPRa ( C ) (n=3). Scale bar, 50 μm. Welch’s t-test was performed to compare on-target (OT) and non-target (NT) activations. ( D ) Median EGFP intensities of genome editing-activated EGFP positive cells (n=3). The Mann-Whitney U test was performed to compare two groups. ( E ) Comparison of Target-AID variants and a nCas9 (D10A) control in the CloneSelect C→T reporter activation for the same set of barcode-gRNA pairs (n=1). Welch’s t-test was performed to compare OT and NT activations. ( F ) Reporter activation in HeLa cells by CloneSelect C→T (n=3). Welch’s t-test was performed to compare OT and NT activations. Scale bar, 80 μm. * P < 0.05; ** P < 0.01; *** P < 0.001.

Article Snippet: Similar to CloneSelect C→T, CloneSelect A→G activated the reporter expression for 12.27–31.47% of on-target cells, whereas the non-target activation was maintained below 0.5% with high orthogonality of barcodes and gRNAs.

Techniques: Activation Assay, MANN-WHITNEY

( A and B ) Barcode-specific gRNA-dependent reporter activation of six barcoded cell lines prepared for each of low-copy CRISPRa and high-copy CRISPRa. Scale bar, 50 μm. ( C ) Median EGFP intensities of genome editing-activated EGFP positive cells (n=3). ( D ) ROC curves along varying reporter intensity thresholds for target barcoded cells. CloneSelect C→T, low-copy CRISPRa, and high-copy CRISPRa were examined for the common set of six barcodes. The Mann-Whitney U test was performed to compare two groups (* P < 0.05; ** P < 0.01; *** P < 0.001). ( E ) Frequencies of CloneSelect C→T reporter-activated cells obtained by transfection of different DNA amounts of barcode-targeting genome editing reagents. ( F ) ROC curve for each input DNA amount along varying reporter intensity thresholds for target barcoded cells.

Journal: bioRxiv

Article Title: A multi-kingdom genetic barcoding system for precise target clone isolation

doi: 10.1101/2023.01.18.524633

Figure Lengend Snippet: ( A and B ) Barcode-specific gRNA-dependent reporter activation of six barcoded cell lines prepared for each of low-copy CRISPRa and high-copy CRISPRa. Scale bar, 50 μm. ( C ) Median EGFP intensities of genome editing-activated EGFP positive cells (n=3). ( D ) ROC curves along varying reporter intensity thresholds for target barcoded cells. CloneSelect C→T, low-copy CRISPRa, and high-copy CRISPRa were examined for the common set of six barcodes. The Mann-Whitney U test was performed to compare two groups (* P < 0.05; ** P < 0.01; *** P < 0.001). ( E ) Frequencies of CloneSelect C→T reporter-activated cells obtained by transfection of different DNA amounts of barcode-targeting genome editing reagents. ( F ) ROC curve for each input DNA amount along varying reporter intensity thresholds for target barcoded cells.

Article Snippet: Similar to CloneSelect C→T, CloneSelect A→G activated the reporter expression for 12.27–31.47% of on-target cells, whereas the non-target activation was maintained below 0.5% with high orthogonality of barcodes and gRNAs.

Techniques: Activation Assay, MANN-WHITNEY, Transfection

( A ) Different mCherry reporter variants tested to establish CloneSelect C→T. ( B and C ) mCherry expression from the different reporter variants with the first codon as GTG or ATG. Scale bar, 50 μm. ( D ) Activation of the M1V (GTG)+Δ2-9 mutant reporter with OT and NT gRNAs (n=3). Scale bar, 100 μm.

Journal: bioRxiv

Article Title: A multi-kingdom genetic barcoding system for precise target clone isolation

doi: 10.1101/2023.01.18.524633

Figure Lengend Snippet: ( A ) Different mCherry reporter variants tested to establish CloneSelect C→T. ( B and C ) mCherry expression from the different reporter variants with the first codon as GTG or ATG. Scale bar, 50 μm. ( D ) Activation of the M1V (GTG)+Δ2-9 mutant reporter with OT and NT gRNAs (n=3). Scale bar, 100 μm.

Article Snippet: Similar to CloneSelect C→T, CloneSelect A→G activated the reporter expression for 12.27–31.47% of on-target cells, whereas the non-target activation was maintained below 0.5% with high orthogonality of barcodes and gRNAs.

Techniques: Expressing, Activation Assay, Mutagenesis

( A – C ) Barcodespecific gRNA-dependent reporter activation of three barcoded cell lines prepared for each of CloneSelect A→G, low-copy CRISPRa, and high-copy CRISPRa. Scale bar, 50 μm. ( D – F ) Flow cytometry analysis of single-cell EGFP activation levels. ( G ) Median EGFP intensities of genome editing-activated EGFP positive cells (n=3). The Mann-Whitney U test was performed to compare two groups (* P < 0.05; ** P < 0.01; *** P < 0.001). ( H ) ROC curves along varying reporter intensity thresholds for target barcoded cells (n=3).

Journal: bioRxiv

Article Title: A multi-kingdom genetic barcoding system for precise target clone isolation

doi: 10.1101/2023.01.18.524633

Figure Lengend Snippet: ( A – C ) Barcodespecific gRNA-dependent reporter activation of three barcoded cell lines prepared for each of CloneSelect A→G, low-copy CRISPRa, and high-copy CRISPRa. Scale bar, 50 μm. ( D – F ) Flow cytometry analysis of single-cell EGFP activation levels. ( G ) Median EGFP intensities of genome editing-activated EGFP positive cells (n=3). The Mann-Whitney U test was performed to compare two groups (* P < 0.05; ** P < 0.01; *** P < 0.001). ( H ) ROC curves along varying reporter intensity thresholds for target barcoded cells (n=3).

Article Snippet: Similar to CloneSelect C→T, CloneSelect A→G activated the reporter expression for 12.27–31.47% of on-target cells, whereas the non-target activation was maintained below 0.5% with high orthogonality of barcodes and gRNAs.

Techniques: Activation Assay, Flow Cytometry, MANN-WHITNEY

( A ) Nucleotide compositions of barcodes in the mammalian CloneSelect C→T plasmid mini-pool. Five barcodes that had unexpected lengths were excluded from this visualization. The full barcode sequence list can be found in Table S1. ( B ) Barcode abundances in the cell population labeled by the mini-lentiviral barcode pool of CloneSelect C→T. ( C ) gRNA-dependent labeling of target barcoded cells in a population. ( D ) Flow cytometry cell sorting of reporter-activated cells. ( E ) Barcode enrichment analysis after cell sorting of the reporter-activated cells. Each row represents the barcode enrichment profile for each target isolation assay.

Journal: bioRxiv

Article Title: A multi-kingdom genetic barcoding system for precise target clone isolation

doi: 10.1101/2023.01.18.524633

Figure Lengend Snippet: ( A ) Nucleotide compositions of barcodes in the mammalian CloneSelect C→T plasmid mini-pool. Five barcodes that had unexpected lengths were excluded from this visualization. The full barcode sequence list can be found in Table S1. ( B ) Barcode abundances in the cell population labeled by the mini-lentiviral barcode pool of CloneSelect C→T. ( C ) gRNA-dependent labeling of target barcoded cells in a population. ( D ) Flow cytometry cell sorting of reporter-activated cells. ( E ) Barcode enrichment analysis after cell sorting of the reporter-activated cells. Each row represents the barcode enrichment profile for each target isolation assay.

Article Snippet: Similar to CloneSelect C→T, CloneSelect A→G activated the reporter expression for 12.27–31.47% of on-target cells, whereas the non-target activation was maintained below 0.5% with high orthogonality of barcodes and gRNAs.

Techniques: Plasmid Preparation, Sequencing, Labeling, Flow Cytometry, FACS, Isolation

( A ) scCloneSelect. ( B and C ) Barcode-specific gRNA-dependent reporter activation of the original CloneSelect C→T and scCloneSelect in HEK293T cells (n=3). Scale bar, 50 μm. ( D and E ) Barcode-specific gRNA-dependent reporter activation of three barcoded mESC lines by scCloneSelect. Target-AID was stably integrated prior to the barcoding. gRNAs were delivered by lentiviral transduction. Scale bar, 100 μm. Welch’s t-test was performed to compare on-target (OT) and non-target (NT) activations. * P < 0.05; ** P < 0.01; *** P < 0.001. ( F ) Schematic diagram of a scCloneSelect workflow to retrospectively isolate a cell clone demonstrating a gene expression profile of interest from a cell population stored before they demonstrate the target gene expression pattern. ( G ) mESC cell culture assays and clone isolation performed in this work. ( H ) scRNA-seq of mESC populations treated with LIF and 2i and those without LIF or 2i. ( I ) Distribution of cells for arbitrarily selected clones in the two-dimensional embedding of high-dimensional gene expression space by UMAP (uniform manifold approximation and projection). ( J ) Abundance of barcoded cell clones in the mESC population. The data was generated based on dntags identified by reamplifying the dntag reads from the original scRNA-seq libraries. ( K ) gRNA-specific activation of target barcoded clones in the mESC population. Scale bar, 50 μm. ( L ) Barcode enrichment analysis after cell sorting of the reporter-activated cells. Each row represents the barcode enrichment profile for each target isolation assay. The left heatmap was expanded from the dashed box area of the right heatmap.

Journal: bioRxiv

Article Title: A multi-kingdom genetic barcoding system for precise target clone isolation

doi: 10.1101/2023.01.18.524633

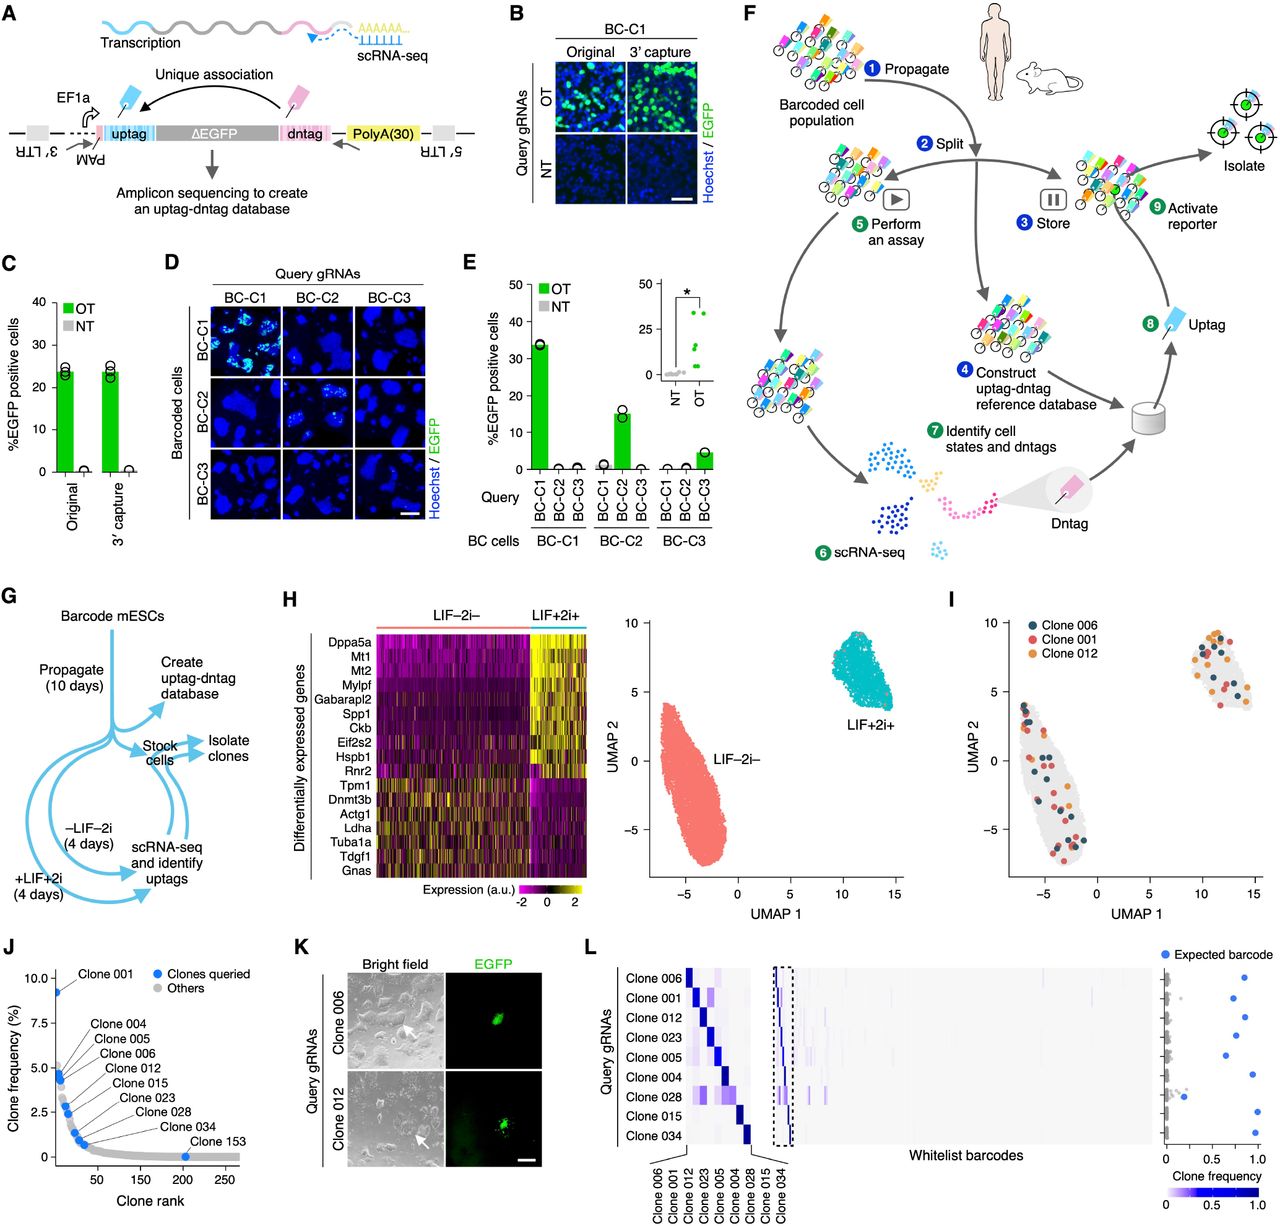
Figure Lengend Snippet: ( A ) scCloneSelect. ( B and C ) Barcode-specific gRNA-dependent reporter activation of the original CloneSelect C→T and scCloneSelect in HEK293T cells (n=3). Scale bar, 50 μm. ( D and E ) Barcode-specific gRNA-dependent reporter activation of three barcoded mESC lines by scCloneSelect. Target-AID was stably integrated prior to the barcoding. gRNAs were delivered by lentiviral transduction. Scale bar, 100 μm. Welch’s t-test was performed to compare on-target (OT) and non-target (NT) activations. * P < 0.05; ** P < 0.01; *** P < 0.001. ( F ) Schematic diagram of a scCloneSelect workflow to retrospectively isolate a cell clone demonstrating a gene expression profile of interest from a cell population stored before they demonstrate the target gene expression pattern. ( G ) mESC cell culture assays and clone isolation performed in this work. ( H ) scRNA-seq of mESC populations treated with LIF and 2i and those without LIF or 2i. ( I ) Distribution of cells for arbitrarily selected clones in the two-dimensional embedding of high-dimensional gene expression space by UMAP (uniform manifold approximation and projection). ( J ) Abundance of barcoded cell clones in the mESC population. The data was generated based on dntags identified by reamplifying the dntag reads from the original scRNA-seq libraries. ( K ) gRNA-specific activation of target barcoded clones in the mESC population. Scale bar, 50 μm. ( L ) Barcode enrichment analysis after cell sorting of the reporter-activated cells. Each row represents the barcode enrichment profile for each target isolation assay. The left heatmap was expanded from the dashed box area of the right heatmap.

Article Snippet: Similar to CloneSelect C→T, CloneSelect A→G activated the reporter expression for 12.27–31.47% of on-target cells, whereas the non-target activation was maintained below 0.5% with high orthogonality of barcodes and gRNAs.

Techniques: Activation Assay, Stable Transfection, Transduction, Expressing, Cell Culture, Isolation, Clone Assay, Generated, FACS

( A ) EGFP-positive control expressions for the original CloneSelect C→T and scCloneSelect in HEK293T cells with the same genome editing conditions tested for the respective reporters (n=3). Scale bar, 50 μm. ( B ) Median EGFP intensities of base editing-activated EGFP positive cells (n=3). ( C and D ) Barcode-specific gRNA-dependent reporter activation of six barcoded cell lines by scCloneSelect (n=1). Welch’s t-test was performed to compare on-target (OT) and non-target (NT) activations (* P < 0.05; ** P < 0.01; *** P < 0.001). Scale bar, 50 μm. ( E ) RT-PCR of the scCloneSelect dntags in HEK293T. ( F ) Fraction of mESC single-cell transcriptome profiles (Drop-seq) that contained dntags and fraction of dntags reported in the uptag-dntag combination reference database. ( G ) Schematic representation of a scCloneSelect reporter activation assay where Target-AID was stably introduced to the cell population prior to barcoding and gRNA-dependent reporter activation. ( H and I ) gRNA-dependent reporter activation of target barcoded mESCs and CA1 hPSCs by scCloneSelect (n=2). Target-AID was stably integrated prior to the barcoding. Targeting gRNAs were delivered by transfection. Welch’s t-test was performed to compare OT and NT activations (* P < 0.05; ** P < 0.01; *** P < 0.001). Scale bar, 100 μm. ( J ) Schematic representation of a scCloneSelect reporter activation assay where the target gRNA and Target-AID were electroporated together to the barcoded cell population. ( K ) gRNA-dependent reporter activation of barcoded H1 hPSCs by scCloneSelect (n=2). Targeting gRNA and Target-AID were electroporated together. Scale bar, 100 μm.

Journal: bioRxiv

Article Title: A multi-kingdom genetic barcoding system for precise target clone isolation

doi: 10.1101/2023.01.18.524633

Figure Lengend Snippet: ( A ) EGFP-positive control expressions for the original CloneSelect C→T and scCloneSelect in HEK293T cells with the same genome editing conditions tested for the respective reporters (n=3). Scale bar, 50 μm. ( B ) Median EGFP intensities of base editing-activated EGFP positive cells (n=3). ( C and D ) Barcode-specific gRNA-dependent reporter activation of six barcoded cell lines by scCloneSelect (n=1). Welch’s t-test was performed to compare on-target (OT) and non-target (NT) activations (* P < 0.05; ** P < 0.01; *** P < 0.001). Scale bar, 50 μm. ( E ) RT-PCR of the scCloneSelect dntags in HEK293T. ( F ) Fraction of mESC single-cell transcriptome profiles (Drop-seq) that contained dntags and fraction of dntags reported in the uptag-dntag combination reference database. ( G ) Schematic representation of a scCloneSelect reporter activation assay where Target-AID was stably introduced to the cell population prior to barcoding and gRNA-dependent reporter activation. ( H and I ) gRNA-dependent reporter activation of target barcoded mESCs and CA1 hPSCs by scCloneSelect (n=2). Target-AID was stably integrated prior to the barcoding. Targeting gRNAs were delivered by transfection. Welch’s t-test was performed to compare OT and NT activations (* P < 0.05; ** P < 0.01; *** P < 0.001). Scale bar, 100 μm. ( J ) Schematic representation of a scCloneSelect reporter activation assay where the target gRNA and Target-AID were electroporated together to the barcoded cell population. ( K ) gRNA-dependent reporter activation of barcoded H1 hPSCs by scCloneSelect (n=2). Targeting gRNA and Target-AID were electroporated together. Scale bar, 100 μm.

Article Snippet: Similar to CloneSelect C→T, CloneSelect A→G activated the reporter expression for 12.27–31.47% of on-target cells, whereas the non-target activation was maintained below 0.5% with high orthogonality of barcodes and gRNAs.

Techniques: Positive Control, Activation Assay, Reverse Transcription Polymerase Chain Reaction, Stable Transfection, Transfection

( A ) Yeast CloneSelect C→T circuit. ( B and C ) Barcode-specific gRNA-dependent reporter activation. Scale bar, 25 μm. Mean mCherry intensity measured by a plate reader was normalized by OD 595 nm (n=3). Welch’s t-test was performed to compare on-target (OT) and non-target (NT) activities. ( D ) GTG→ATG editing frequencies observed by high-throughput sequencing. Welch’s t-test was performed to compare OT and NT datasets. ( E ) Yeast colonies formed on a 10-cm agar plate after performing a target clone labeling in the yeast cell population of Pool-100. ( F–J ) Analysis of colonies isolated after clone labeling using each targeting gRNA. ( F ) mCherry positive isolates from Pool-100. ( G ) mCherry negative isolates from Pool-100. ( H ) mCherry positive isolates from Pool-1580. ( I ) mCherry negative isolates from Pool-1580. ( J ) Summary of the analysis results. * P < 0.05; ** P < 0.01; *** P < 0.001.

Journal: bioRxiv

Article Title: A multi-kingdom genetic barcoding system for precise target clone isolation

doi: 10.1101/2023.01.18.524633

Figure Lengend Snippet: ( A ) Yeast CloneSelect C→T circuit. ( B and C ) Barcode-specific gRNA-dependent reporter activation. Scale bar, 25 μm. Mean mCherry intensity measured by a plate reader was normalized by OD 595 nm (n=3). Welch’s t-test was performed to compare on-target (OT) and non-target (NT) activities. ( D ) GTG→ATG editing frequencies observed by high-throughput sequencing. Welch’s t-test was performed to compare OT and NT datasets. ( E ) Yeast colonies formed on a 10-cm agar plate after performing a target clone labeling in the yeast cell population of Pool-100. ( F–J ) Analysis of colonies isolated after clone labeling using each targeting gRNA. ( F ) mCherry positive isolates from Pool-100. ( G ) mCherry negative isolates from Pool-100. ( H ) mCherry positive isolates from Pool-1580. ( I ) mCherry negative isolates from Pool-1580. ( J ) Summary of the analysis results. * P < 0.05; ** P < 0.01; *** P < 0.001.

Article Snippet: Similar to CloneSelect C→T, CloneSelect A→G activated the reporter expression for 12.27–31.47% of on-target cells, whereas the non-target activation was maintained below 0.5% with high orthogonality of barcodes and gRNAs.

Techniques: Activation Assay, Next-Generation Sequencing, Labeling, Isolation

( A ) Different mCherry reporter variants tested to establish CloneSelect C→T. The different reporter variants were tested with the first codon as GTG or ATG. Scale bar, 100 μm. ( B ) Canavanine resistance assays for different CRISPR genome editing enzymes with a gRNA targeting CAN1 gene and a control NT gRNA. For each experiment, cell concentration was normalized to 1.0 OD 595 nm and serially diluted with 10-fold increments for spotting. ( C ) Estimated CFU counts for the same assay in ( B ). ( D ) Genome editing outcomes observed by amplicon sequencing. Frequencies of mutation patterns observed across the target sequence region are shown for the same assay in ( B ). ( E ) Genome editing frequencies at the target CAN1 locus estimated by amplicon sequencing for the different enzymes. ( F ) Activation of the mCherry M1V (GTG)+Δ2-9 mutant reporter by OT and NT gRNAs. Scale bar, 200 μm. ( G ) mCherry-positive control expressions for yeast CloneSelect. Yeast cells having the positive control reporters with three different barcodes (BC-C1, BC-C2, and BC-C3) were each treated by Target-AID and three different targeting gRNAs. Scale bar, 25 μm.

Journal: bioRxiv

Article Title: A multi-kingdom genetic barcoding system for precise target clone isolation

doi: 10.1101/2023.01.18.524633

Figure Lengend Snippet: ( A ) Different mCherry reporter variants tested to establish CloneSelect C→T. The different reporter variants were tested with the first codon as GTG or ATG. Scale bar, 100 μm. ( B ) Canavanine resistance assays for different CRISPR genome editing enzymes with a gRNA targeting CAN1 gene and a control NT gRNA. For each experiment, cell concentration was normalized to 1.0 OD 595 nm and serially diluted with 10-fold increments for spotting. ( C ) Estimated CFU counts for the same assay in ( B ). ( D ) Genome editing outcomes observed by amplicon sequencing. Frequencies of mutation patterns observed across the target sequence region are shown for the same assay in ( B ). ( E ) Genome editing frequencies at the target CAN1 locus estimated by amplicon sequencing for the different enzymes. ( F ) Activation of the mCherry M1V (GTG)+Δ2-9 mutant reporter by OT and NT gRNAs. Scale bar, 200 μm. ( G ) mCherry-positive control expressions for yeast CloneSelect. Yeast cells having the positive control reporters with three different barcodes (BC-C1, BC-C2, and BC-C3) were each treated by Target-AID and three different targeting gRNAs. Scale bar, 25 μm.

Article Snippet: Similar to CloneSelect C→T, CloneSelect A→G activated the reporter expression for 12.27–31.47% of on-target cells, whereas the non-target activation was maintained below 0.5% with high orthogonality of barcodes and gRNAs.

Techniques: CRISPR, Concentration Assay, Amplification, Sequencing, Mutagenesis, Activation Assay, Positive Control

( A ) Bacterial CloneSelect A→G circuit. ABE and gRNA expressions were controlled by IPTG-inducible promoters, and the EGFP reporter expression was controlled by an arabinose-inducible promoter. ( B and C ) EGFP reporter activation of E. coli cells under different inducer conditions. Scale bar, 25 μm. Mean EGFP intensity measured by a plate reader was normalized by OD 595 nm (n=3). Welch’s t-test was performed to compare on-target (OT) and non-target (NT) activities. ( D ) Base editing outcomes analyzed by Sanger sequencing. ( E ) Activities of the positive control EGFP reporter under the same conditions tested for (C) (n=3). Welch’s t-test was performed to compare OT and NT activities. ( F ) Zeocin resistance marker-based circuit. ( G ) Barcode-specific gRNA-dependent Zeocin resistance reporter activation. ( H ) Schematic diagram of a bacterial CloneSelect workflow using a drug selective condition for the target barcoded cell isolation. ( I ) Abundance of barcoded cells in Pool-100 and Pool-1550. ( J ) Colonies formed on Zeocin-selective and non-selective solid agar plates after performing the reporter activation of Clone 106 in the E. coli cell population of Pool-100. ( K ) Analysis of colonies isolated from Zeocin selective and non-selective plates obtained after clone labeling using each targeting gRNA. * P < 0.05; ** P < 0.01; *** P < 0.001.

Journal: bioRxiv

Article Title: A multi-kingdom genetic barcoding system for precise target clone isolation

doi: 10.1101/2023.01.18.524633

Figure Lengend Snippet: ( A ) Bacterial CloneSelect A→G circuit. ABE and gRNA expressions were controlled by IPTG-inducible promoters, and the EGFP reporter expression was controlled by an arabinose-inducible promoter. ( B and C ) EGFP reporter activation of E. coli cells under different inducer conditions. Scale bar, 25 μm. Mean EGFP intensity measured by a plate reader was normalized by OD 595 nm (n=3). Welch’s t-test was performed to compare on-target (OT) and non-target (NT) activities. ( D ) Base editing outcomes analyzed by Sanger sequencing. ( E ) Activities of the positive control EGFP reporter under the same conditions tested for (C) (n=3). Welch’s t-test was performed to compare OT and NT activities. ( F ) Zeocin resistance marker-based circuit. ( G ) Barcode-specific gRNA-dependent Zeocin resistance reporter activation. ( H ) Schematic diagram of a bacterial CloneSelect workflow using a drug selective condition for the target barcoded cell isolation. ( I ) Abundance of barcoded cells in Pool-100 and Pool-1550. ( J ) Colonies formed on Zeocin-selective and non-selective solid agar plates after performing the reporter activation of Clone 106 in the E. coli cell population of Pool-100. ( K ) Analysis of colonies isolated from Zeocin selective and non-selective plates obtained after clone labeling using each targeting gRNA. * P < 0.05; ** P < 0.01; *** P < 0.001.

Article Snippet: Similar to CloneSelect C→T, CloneSelect A→G activated the reporter expression for 12.27–31.47% of on-target cells, whereas the non-target activation was maintained below 0.5% with high orthogonality of barcodes and gRNAs.

Techniques: Expressing, Activation Assay, Sequencing, Positive Control, Marker, Cell Isolation, Isolation, Labeling

( A ) Activities of the positive control EGFP reporter. ABE and gRNA expression were controlled by an IPTG-inducible promoter, and the EGFP reporter expression was controlled by an arabinose-inducible promoter. ( B ) Base editing outcomes of the positive control reporters analyzed by Sanger sequencing. ( C ) Testing of Zeocin resistances conferred by two promoters expressing a Zeocin resistance gene with and without the upstream stop codon to block the selective marker translation. Each cell sample concentration was first adjusted to 0.1 OD 595 nm and serially diluted with 10-fold increments for spotting 5 μL. ( D ) Testing of cell viability under a non-selective condition for a constitutively active T7 promoter and the IPTG-inducible promoter to express the gRNA. OT and NT gRNAs were tested for the gRNA-dependent EGFP reporter and the positive control EGFP reporter. ABE was expressed under the IPTG-inducible promoter without IPTG provided. ( E ) gRNA-dependent Zeocin resistance reporter activation tested for the IPTG-inducible promoters with and without IPTG. ( F ) Bacterial CloneSelect using the Blasticidin resistance gene. Each cell sample concentration was first adjusted to 0.1 OD 595 nm and serially diluted with 10-fold increments for spotting 5 μL. ( G ) gRNA-dependent Blasticidin-resistance reporter activation tested for different inducer conditions and different Blasticidin concentrations. Each cell sample concentration was adjusted to 0.1 OD 595 nm for spotting 5 μL.

Journal: bioRxiv

Article Title: A multi-kingdom genetic barcoding system for precise target clone isolation

doi: 10.1101/2023.01.18.524633

Figure Lengend Snippet: ( A ) Activities of the positive control EGFP reporter. ABE and gRNA expression were controlled by an IPTG-inducible promoter, and the EGFP reporter expression was controlled by an arabinose-inducible promoter. ( B ) Base editing outcomes of the positive control reporters analyzed by Sanger sequencing. ( C ) Testing of Zeocin resistances conferred by two promoters expressing a Zeocin resistance gene with and without the upstream stop codon to block the selective marker translation. Each cell sample concentration was first adjusted to 0.1 OD 595 nm and serially diluted with 10-fold increments for spotting 5 μL. ( D ) Testing of cell viability under a non-selective condition for a constitutively active T7 promoter and the IPTG-inducible promoter to express the gRNA. OT and NT gRNAs were tested for the gRNA-dependent EGFP reporter and the positive control EGFP reporter. ABE was expressed under the IPTG-inducible promoter without IPTG provided. ( E ) gRNA-dependent Zeocin resistance reporter activation tested for the IPTG-inducible promoters with and without IPTG. ( F ) Bacterial CloneSelect using the Blasticidin resistance gene. Each cell sample concentration was first adjusted to 0.1 OD 595 nm and serially diluted with 10-fold increments for spotting 5 μL. ( G ) gRNA-dependent Blasticidin-resistance reporter activation tested for different inducer conditions and different Blasticidin concentrations. Each cell sample concentration was adjusted to 0.1 OD 595 nm for spotting 5 μL.

Article Snippet: Similar to CloneSelect C→T, CloneSelect A→G activated the reporter expression for 12.27–31.47% of on-target cells, whereas the non-target activation was maintained below 0.5% with high orthogonality of barcodes and gRNAs.

Techniques: Positive Control, Expressing, Sequencing, Blocking Assay, Marker, Concentration Assay, Activation Assay

( A ) Three-gRNA-input OR gate with CloneSelect C→T that is designed to confer the EGFP reporter expression by any of the three barcode-specific gRNA-dependent GTG→ATG mutations. ( B ) Three-gRNA-input AND gate with CloneSelect A→G that is designed to confer the EGFP reporter expression when all three barcode-specific gRNA-dependent TAA→CAA mutations are provided.

Journal: bioRxiv

Article Title: A multi-kingdom genetic barcoding system for precise target clone isolation

doi: 10.1101/2023.01.18.524633

Figure Lengend Snippet: ( A ) Three-gRNA-input OR gate with CloneSelect C→T that is designed to confer the EGFP reporter expression by any of the three barcode-specific gRNA-dependent GTG→ATG mutations. ( B ) Three-gRNA-input AND gate with CloneSelect A→G that is designed to confer the EGFP reporter expression when all three barcode-specific gRNA-dependent TAA→CAA mutations are provided.

Article Snippet: Similar to CloneSelect C→T, CloneSelect A→G activated the reporter expression for 12.27–31.47% of on-target cells, whereas the non-target activation was maintained below 0.5% with high orthogonality of barcodes and gRNAs.

Techniques: Expressing

Patient-derived organoids (PDOs) recapitulate transcriptional heterogeneity of primary pancreatic ductal adenocarcinoma (PDAC) and reveal recurrent programs (RPs). A and B Uniform manifold approximation and projections (UMAPs) of single-cell transcriptomes from 17 PDOs, analyzed sample by sample. The cells were clustered within each PDO, and UMAPs are shown separately for primary ( A ) and metastasis PDOs ( B ). C Pairwise similarity analysis of gene expression programs (GEPs) identified by consensus nonnegative matrix factorization (cNMF) across the 17 PDOs. The heatmap shows the pairwise similarity matrix of 108 GEPs, which was quantified using the Jaccard index, with hierarchical clustering revealing eight major clusters defined as RPs shared across multiple PDOs. The eight RP assignments and representative genes for each RP are shown on the right. D Heatmap showing the degree of gene-level overlap between the eight RPs that were identified in this study and the 14 GEPs that were previously reported from single-cell transcriptomic analysis of PDAC patient specimens. E Differential analysis of RP activity between primary and metastasis PDOs

Journal: Journal of Experimental & Clinical Cancer Research : CR

Article Title: Patient-derived orthotopic xenograft models recapitulate the peritoneal dissemination of pancreatic cancer and delineate its transcriptional and regulatory programs

doi: 10.1186/s13046-026-03668-9

Figure Lengend Snippet: Patient-derived organoids (PDOs) recapitulate transcriptional heterogeneity of primary pancreatic ductal adenocarcinoma (PDAC) and reveal recurrent programs (RPs). A and B Uniform manifold approximation and projections (UMAPs) of single-cell transcriptomes from 17 PDOs, analyzed sample by sample. The cells were clustered within each PDO, and UMAPs are shown separately for primary ( A ) and metastasis PDOs ( B ). C Pairwise similarity analysis of gene expression programs (GEPs) identified by consensus nonnegative matrix factorization (cNMF) across the 17 PDOs. The heatmap shows the pairwise similarity matrix of 108 GEPs, which was quantified using the Jaccard index, with hierarchical clustering revealing eight major clusters defined as RPs shared across multiple PDOs. The eight RP assignments and representative genes for each RP are shown on the right. D Heatmap showing the degree of gene-level overlap between the eight RPs that were identified in this study and the 14 GEPs that were previously reported from single-cell transcriptomic analysis of PDAC patient specimens. E Differential analysis of RP activity between primary and metastasis PDOs

Article Snippet: scATAC-seq was conducted using the ddSEQ Single-Cell Isolator (Bio-Rad), and data were analyzed using ArchR (v1.0.2) in accordance with a previous study [ ].

Techniques: Derivative Assay, Single Cell, Gene Expression, Activity Assay

Single-cell multiomic analysis of the PDOX12 lineage revealing dissemination-associated transcriptional programs. A Schematic overview of the PDOX12 lineage used for single-nucleus RNA sequencing. The colors indicate the tissue origin: green circle, primary pancreatic lesion from PDOX12 (PDOX12-P); yellow circle, primary pancreatic lesion from PDOX12P (PDOX12P-P); gray circle, primary pancreatic lesion from PDOX12A (PDOX12A-P); violet circle, peritoneal metastatic lesion from PDOX12A (PDOX12A-A). B and C Uniform manifold approximation and projection (UMAP) visualization of 21,523 single-nucleus transcriptomes from the four tumors. Cells colored by cluster identity ( B ) and sample of origin ( C ). D Proportion of each cluster across the four tumors. E Number of cluster-specific differentially expressed genes (DEGs). F Representative examples of cluster-4 and cluster-1-specific DEGs expression on UMAPs. G UMAP visualization of single-cell ATAC sequencing (scATAC-seq) of PDOX12A-P and PDOX12A-A. Cells colored by sample of origin. H UMAPs colored by gene-activity scores for cluster-4-specific DEGs. I – K Integrative analysis of chromatin accessibility and transcriptional activity using scATAC-seq data. Correlations were calculated between the module scores (derived from gene activity scores of cluster-specific DEGs) and the motif activity scores across all single nuclei. I Example scatter plot showing the correlation between cluster-4-specific DEG module score and SOX2 motif activity score at the single-cell level. J Heatmap showing the correlation coefficients between each DEG module score and all transcription factor motif activity scores, identifying regulatory modules with shared motif-association patterns. K UMAP illustrating the representative motif activities correlated with the cluster-4-specific DEG modules

Journal: Journal of Experimental & Clinical Cancer Research : CR

Article Title: Patient-derived orthotopic xenograft models recapitulate the peritoneal dissemination of pancreatic cancer and delineate its transcriptional and regulatory programs

doi: 10.1186/s13046-026-03668-9

Figure Lengend Snippet: Single-cell multiomic analysis of the PDOX12 lineage revealing dissemination-associated transcriptional programs. A Schematic overview of the PDOX12 lineage used for single-nucleus RNA sequencing. The colors indicate the tissue origin: green circle, primary pancreatic lesion from PDOX12 (PDOX12-P); yellow circle, primary pancreatic lesion from PDOX12P (PDOX12P-P); gray circle, primary pancreatic lesion from PDOX12A (PDOX12A-P); violet circle, peritoneal metastatic lesion from PDOX12A (PDOX12A-A). B and C Uniform manifold approximation and projection (UMAP) visualization of 21,523 single-nucleus transcriptomes from the four tumors. Cells colored by cluster identity ( B ) and sample of origin ( C ). D Proportion of each cluster across the four tumors. E Number of cluster-specific differentially expressed genes (DEGs). F Representative examples of cluster-4 and cluster-1-specific DEGs expression on UMAPs. G UMAP visualization of single-cell ATAC sequencing (scATAC-seq) of PDOX12A-P and PDOX12A-A. Cells colored by sample of origin. H UMAPs colored by gene-activity scores for cluster-4-specific DEGs. I – K Integrative analysis of chromatin accessibility and transcriptional activity using scATAC-seq data. Correlations were calculated between the module scores (derived from gene activity scores of cluster-specific DEGs) and the motif activity scores across all single nuclei. I Example scatter plot showing the correlation between cluster-4-specific DEG module score and SOX2 motif activity score at the single-cell level. J Heatmap showing the correlation coefficients between each DEG module score and all transcription factor motif activity scores, identifying regulatory modules with shared motif-association patterns. K UMAP illustrating the representative motif activities correlated with the cluster-4-specific DEG modules

Article Snippet: scATAC-seq was conducted using the ddSEQ Single-Cell Isolator (Bio-Rad), and data were analyzed using ArchR (v1.0.2) in accordance with a previous study [ ].

Techniques: Single Cell, RNA Sequencing, Expressing, Sequencing, Activity Assay, Derivative Assay